#015: Sensitivity Analysis
- Mar 28, 2018
- 3 min read
Updated: Jan 13, 2021
All physical components, be it mechanical, eletrical, or other, have tolerances. That means that any theoretical responses will deviate from the actual physical response. But how do we quantify the signicances of different tolerances in a system? The answer is Sensitivity Analysis.
What you are often interested in is how much relative change to I get in my response/objective for a given relative change in some parameter/component. This ratio can be expressed mathematically via a so-called sensitivity factor, or simply sensitivity as:

That means that if the sensitivity is 2, then a tolerance of A % on the parameter x will result in a 2A % tolerance on the response/output f, for small tolerances. The higher the sensitivity, the more critical component tolerance is. Since your output is often dependent on more than one input the total relative deviation can be found as

Also note that sometimes the sensitivity is not simply a number, but a funtion of one or more of the parameters.
Let us illustrate with an example: We want to design a second order low-pass filter with a crossover frequency of f0=4.8 kHz, a Q=1, and an arbitrary passband amplification denoted K. With these three design parameters the transfer funtion is fully defined, but there are different implementations that will achieve this. For example, a so-called Sallen-Key can be used, with its general low-pass implementation shown below.

The transfer funtion for the circuit is well known, and so the sensitivity factors can be calculated for the three design parameters a, Q and K, as I did it in [1]; note that Tx=1/(2*pi*f0) and a=1/Q:
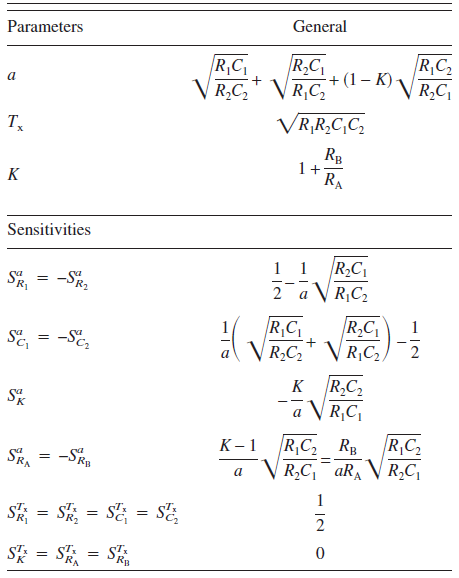
Several interesting facts can be learned from the table. For example, the sensitivity of a(=1/Q) to the resistors Ra and Rb has a (K-1) factor in it, meaning that for high K values, the tolerance on Q will be high. This will of course be an issue, if you need to realize a high K with the Sallen-Key implementation. And it cannot be fixed by low tolerance components; it is simply an inherent trade of this particular implementation. Other implementations such as the Multiple Feedback or the State Variable generally have lower sensitivities, but the Sallen-Key implementation can sometimes be tweeked to be less sensitive. In [2] two Sallen-Key implementations for the f0=4.8 kHz, Q=1 example have been explored, one is from another reference (Original Filter) and an improved implementation is sought by the author:
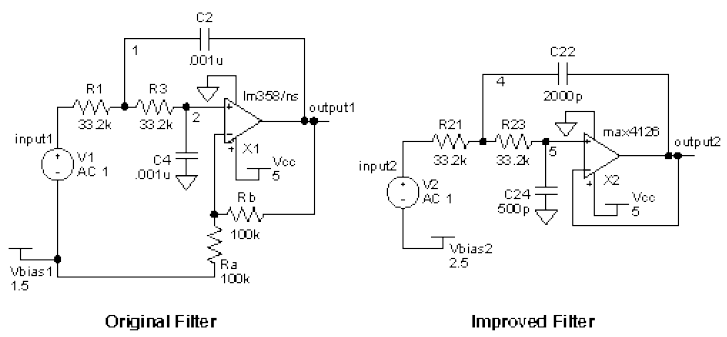
The improved filter has unity gain (K=1) which we have seen will be advantegous compared to having higher K-values, such as the K=2 for the original filter. A Monte-Carlo analysis was run for both Sallen-Key implementations, where the tolerances for all components are input (here, resistors are 1 %, and capacitors are 5 %), and the software tries out the different value combinations within these tolerances:

It is clearly seen that for the original filter the variance is high, whereas for the improved filter the possible outcomes are more tightly packed, for the same component tolerances.
With sensitivity analysis you can investigate where it makes sense to spend more effort and/or money to have less variation in the final response. Sometimes you will be surprised by the analysis, othertimes you may be able to just use intuition. However, I do not see many engineers, or students for that matter, using sensitivity analysis, which is a shame and a main driver for this blog post. Perhaps you have some mechanical or acoustical setup for which you don't actually know the sensitivities, be it a shaker, a loudspeaker, or otherwise:
In the above analysis with the Sallen-Key implementations, we knew an analytical expression for the response of interest, and so analytical sensitivities could be found. This is of course not always the case. As briefly shown, you can at least try doing a Monte-Carlo analysis, if you have an electric circuit in PSpice, or a simulation setup in COMSOL Multiphysics or other software. But some simulation software also has sensitivity analysis built-in, and with the above introduction you should be able to get into this functionality, terminology and so on. Also, try looking in to Design of Experiments (DOE) and other related topics, if you are interested in how input parameters/processes related to your outputs. There is also certain considerations related to the approach described above, see e.g. [3], but I will not get into the details of this.
I hope this blog post has given you a little insight into sensitivity analysis, and perhaps even an incentive to start applying it on YOUR applications.
[1]: Active All-Pass Crossover Networks with Equal Resistors and Equal Capacitors, René Christensen, J. Audio Eng. Soc., Vol. 54, No. 1/2, 2006 January/February
[2]: Maxim application note 738, Minimizing Component-Variation Sensitivity in Single Op Amp filters, Mar 21 2001
[3]: A Review of Techniques for Parameter Sensitivity Analysis of Environmental Models, D.M. Hamby, Westinghouse Savannah River Company Savannah River Technology Center Aiken, SC 29808, U.S.A.
Comments